15 · Observability, Cost, and Logs
§1 · TL;DR
Section titled “§1 · TL;DR”§2 · Architecture Diagram
Section titled “§2 · Architecture Diagram”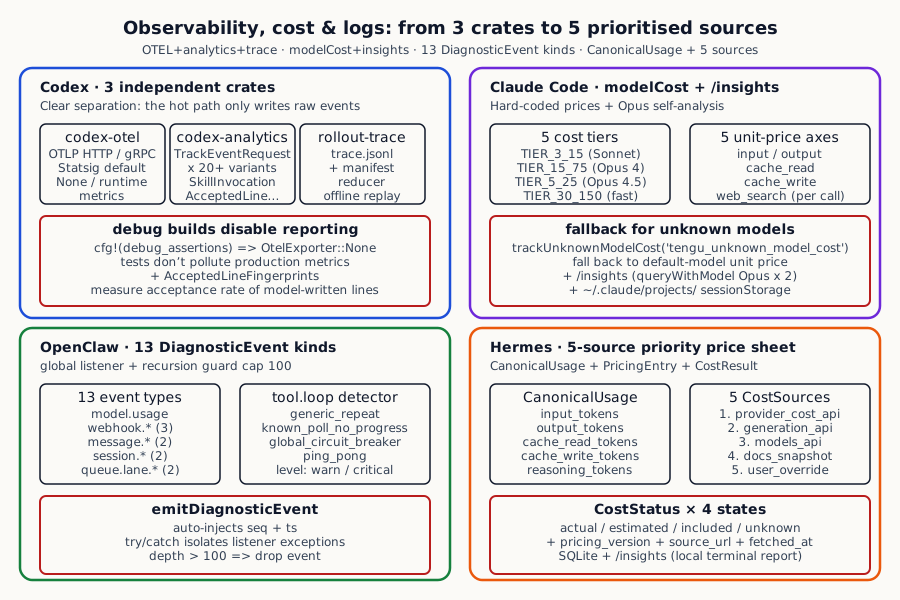
How the four systems cover observability, cost, and logs across five dimensions:
| Dimension | Codex | Claude Code | OpenClaw | Hermes |
|---|---|---|---|---|
| Token accounting | `TokenUsage` (input / output / cache_creation / cache_read / reasoning_output) in codex-protocol crate | BetaUsage (@anthropic-ai/sdk): input_tokens / output_tokens / cache_read_input_tokens / cache_creation_input_tokens / server_tool_use.web_search_requests | `DiagnosticUsageEvent.usage`: input / output / cacheRead / cacheWrite / promptTokens / total + lastCallUsage | `CanonicalUsage`: input_tokens + output_tokens + cache_read_tokens + cache_write_tokens + reasoning_tokens + request_count |
| Pricing table | Maintained in model-provider-info crate; analytics reports usd_cost but does not hardcode prices | Hardcoded 5 cost tiers (COST_TIER_3_15 / COST_TIER_15_75 / COST_TIER_5_25 / COST_TIER_30_150 / COST_HAIKU_xx) plus MODEL_COSTS map | Through model metadata + `costUsd` field; diagnostic-events just emit, do not store prices | `_OFFICIAL_DOCS_PRICING` dict with 30+ models across anthropic / openai / google / cohere; carries `pricing_version` and source_url |
| Cost source | Model provider info + upstream API returned usd_cost | Computed from modelCost.ts (weighted sum across 4 components) | Gateway calculates and emits costUsd as part of the event | `CostSource` enum of 5: provider_cost_api / provider_generation_api / provider_models_api / official_docs_snapshot / user_override / custom_contract |
| Remote reporting | OTLP HTTP/gRPC generic + Statsig built-in default exporter (off by default in debug builds) | logEvent("tengu_*") to Anthropic analytics endpoint | External listeners plug into OTEL / Datadog / etc. | No remote reporting; everything local SQLite + local report (`InsightsEngine`) |
| Historical replay | rollout-trace crate: trace bundle + reducer + replay; codex debug trace-reduce tool | `getSessionFilesWithMtime` + `loadAllLogsFromSessionFile` read session files in ~/.claude/projects/ | diagnostic-events stay in memory; listeners decide persistence | `InsightsEngine` queries SessionDB SQLite directly with group-by + cost rollups; /insights prints terminal report |
§3 · How Each System Does It
Section titled “§3 · How Each System Does It”Codex · Splitting observability into three things that do not fight with each other
Section titled “Codex · Splitting observability into three things that do not fight with each other”Codex’s stance on observability is very engineering-minded: it argues that observability is really three different problems with very different requirements, and trying to do all three in one module makes none of them good. So it splits the entire capability into three independent code modules, each focused on one thing, with no coupling between them.
The first thing is plugging into the industry-standard monitoring protocol. Any serious production team already has monitoring infrastructure in place — it might be Datadog, Honeycomb, Splunk, Aliyun ARMS, or a self-hosted Prometheus + Grafana stack. All of these backends speak the OpenTelemetry (OTEL) standard. Rather than building its own monitoring system, Codex writes an adapter that emits the agent’s internal metrics, traces, and logs over the OTEL protocol (supporting both HTTP and gRPC transports), and lets the user plug the data into whatever they already use. On top of that it ships a default exporter for an internal system called Statsig — that one exists because Codex’s own team uses Statsig to collect product analytics.
Codex codex/codex-rs/otel/src/config.rs:50-108 — The observability backend is abstracted into a pluggable exporter — fully off, internal default, HTTP, or gRPC. Each of metrics / traces / logs can be configured independently.
#[derive(Clone, Debug)]pub struct OtelSettings {    pub environment: String,    pub service_name: String,    pub service_version: String,    pub codex_home: PathBuf,    pub exporter: OtelExporter,    pub trace_exporter: OtelExporter,    pub metrics_exporter: OtelExporter,    pub runtime_metrics: bool,    pub span_attributes: BTreeMap<String, String>,    pub tracestate: BTreeMap<String, BTreeMap<String, String>>,}
#[derive(Clone, Debug)]pub enum OtelExporter {    None,    /// Statsig metrics ingestion exporter using Codex-internal defaults.    Statsig,    OtlpGrpc {        endpoint: String,        headers: HashMap<String, String>,        tls: Option<OtelTlsConfig>,    },    OtlpHttp {        endpoint: String,        // ...    },}
Two details in this abstraction are worth calling out.
First, the three classes of data can be sent to different destinations. Metrics (numerical indicators like requests-per-second), traces (full call chains for one request), and logs (structured log lines) are fundamentally different things in the monitoring world, and the backends that serve them well are often different — Datadog is great at traces, Grafana is often a better fit for metrics, ELK might own logs. Codex lets each of these pick its own destination instead of forcing everything into one backend.
Second, debug builds default to no reporting against production monitoring. There is one critical line of code in here: if the build is in debug mode (i.e. a developer is locally compiling for testing), the exporter defaults to None. This is very deliberate engineering discipline — running tests during development tends to produce all kinds of weird metric spikes, and if that data leaks into the production monitoring dashboards, operators will be misled into thinking something is wrong in production.
The second thing is rolling up business-level events. The OTEL layer above handles technical metrics, but agents have a separate class of events that matter — which skill the user invoked, which tools ran, which files were touched, how many turns the model went, how many MCP calls happened, and how many lines of generated code the user actually accepted. These are not generic CPU / memory metrics — they are the agent’s own product metrics.
Codex codex/codex-rs/analytics/src/events.rs:56-100 — Business events are expressed as a tagged union — every event has its own field definitions instead of being a generic struct with string-keyed properties.
#[derive(Serialize)]#[serde(untagged)]pub(crate) enum TrackEventRequest { SkillInvocation(SkillInvocationEventRequest), ThreadInitialized(ThreadInitializedEvent), GuardianReview(Box<GuardianReviewEventRequest>), AppMentioned(CodexAppMentionedEventRequest), AppUsed(CodexAppUsedEventRequest), HookRun(CodexHookRunEventRequest), Compaction(Box<CodexCompactionEventRequest>), TurnEvent(Box<CodexTurnEventRequest>), TurnSteer(CodexTurnSteerEventRequest), CommandExecution(CodexCommandExecutionEventRequest), FileChange(CodexFileChangeEventRequest), McpToolCall(CodexMcpToolCallEventRequest), DynamicToolCall(CodexDynamicToolCallEventRequest), CollabAgentToolCall(CodexCollabAgentToolCallEventRequest), WebSearch(CodexWebSearchEventRequest), ImageGeneration(CodexImageGenerationEventRequest), AcceptedLineFingerprints(Box<CodexAcceptedLineFingerprintsEventRequest>), ReviewEvent(CodexReviewEventRequest), PluginUsed(CodexPluginUsedEventRequest), PluginInstalled(CodexPluginEventRequest), PluginUninstalled(CodexPluginEventRequest), // ...}This “every event is its own type” approach is very different from the common pattern of “one generic event struct plus a bag of string-keyed properties”. The benefits are immediate: the compiler at the emit site checks whether you filled in every field (forgetting one fails to compile), the receiver doing aggregate analysis cannot be tripped up by typoed field names, and adding a new event type is just adding a new type that does not break any existing event. These twenty-plus event types cover nearly every business-level surface inside the agent worth caring about — skill invocations, guardian reviews, hook runs, context compactions, single-turn content, command executions, file changes, all kinds of tool calls (including MCP and dynamic tools), web searches, image generations, plugin lifecycle, even an event called “accepted line fingerprints” — which records which lines of model-generated code the user actually kept (using line-level hashes rather than content, to avoid leaking source), all in service of measuring “the fraction of generated code that actually survives”, a key product KPI.
The third thing is packaging the whole conversation into an offline-replayable trace. This one is heavier than the other two — it solves a debugging problem unique to agent systems: when an agent produces a strange result, reproducing it is extremely hard (LLM nondeterminism, external API state, filesystem state all conspire against you), and figuring out “how exactly did it get to that point” after the fact is nearly impossible. Codex’s approach is to write every raw event a session produces, in order, to a JSONL file, plus a manifest describing what model / environment / version was used, and pack the whole thing into a trace bundle that can be shipped to any debugging tool offline. Alongside this is a “reducer” component, specifically designed to fold the raw event stream into a clean final state — just like a Redux reducer, taking an event stream and producing a state snapshot. The design philosophy is written very plainly: the conversation hot path only writes raw events; the heavy reducers and viewers do not pollute the main codebase.
Claude Code · Hardcoding prices into the code so users can see what they spent right in the terminal
Section titled “Claude Code · Hardcoding prices into the code so users can see what they spent right in the terminal”Claude Code’s take on observability is IDE-flavored — it assumes its users are mostly developers, and that those developers care less about “plugging into my own Datadog” than about “telling me right in the terminal how much that session cost me, how many tokens it used, and which model was the most expensive”. Around that judgement it does a few very focused things.
The first thing is hardcoding model prices into the source code. It does not call any remote pricing API or maintain an external pricing manifest — it writes the prices of every currently supported model as a set of constants directly in the source.
Claude Code claude-code/src/utils/modelCost.ts:26-90 — 5 hardcoded cost tiers (COST_TIER_3_15 / COST_TIER_15_75 / COST_TIER_5_25 / COST_TIER_30_150 / COST_HAIKU_35 / COST_HAIKU_45); each tier covers 5 dimensions (input / output / cache_write / cache_read / web_search)
export type ModelCosts = {  inputTokens: number  outputTokens: number  promptCacheWriteTokens: number  promptCacheReadTokens: number  webSearchRequests: number}
// Standard pricing tier for Sonnet models: $3 input / $15 output per Mtokexport const COST_TIER_3_15 = {  inputTokens: 3,  outputTokens: 15,  promptCacheWriteTokens: 3.75,  promptCacheReadTokens: 0.3,  webSearchRequests: 0.01,} as const satisfies ModelCosts
// Pricing tier for Opus 4/4.1: $15 input / $75 output per Mtokexport const COST_TIER_15_75 = {  inputTokens: 15,  outputTokens: 75,  promptCacheWriteTokens: 18.75,  promptCacheReadTokens: 1.5,  webSearchRequests: 0.01,} as const satisfies ModelCosts
// Fast mode pricing for Opus 4.6: $30 input / $150 output per Mtokexport const COST_TIER_30_150 = {  inputTokens: 30,  outputTokens: 150,  promptCacheWriteTokens: 37.5,  promptCacheReadTokens: 3,  webSearchRequests: 0.01,} as const satisfies ModelCosts
The cost function:
function tokensToUSDCost(modelCosts: ModelCosts, usage: Usage): number { return ( (usage.input_tokens / 1_000_000) * modelCosts.inputTokens + (usage.output_tokens / 1_000_000) * modelCosts.outputTokens + ((usage.cache_read_input_tokens ?? 0) / 1_000_000) * modelCosts.promptCacheReadTokens + ((usage.cache_creation_input_tokens ?? 0) / 1_000_000) * modelCosts.promptCacheWriteTokens + (usage.server_tool_use?.web_search_requests ?? 0) * modelCosts.webSearchRequests )}On the surface this looks unengineered — every price change requires a new release. But on closer look it is exactly the trade-off Claude Code wants: its users are developers running a binary on their own machines; if prices could be remotely pushed, it would mean Anthropic could silently change a price and watch every user’s local cost statistics shift in lockstep, which destroys trust. Baking the prices into the code and binding them to a version number makes the whole thing transparent — users know precisely “this version recognises this price table”; raising prices means shipping a new version, in the open.
Prices are organised into six tiers (called “cost tiers”), each tier covering models that share the same price band — Sonnet-class models sit at one tier ($3 per million input / $15 per million output), Opus 4 / 4.1 sit at another ($15 / $75), Haiku sits at the cheaper tiers. Each tier records five prices: input, output, prompt cache write, prompt cache read, and per-call web search. Computing cost is just multiplying each kind of usage by its own price and summing — nothing fancy — but you have to keep the five separate or it will be wildly wrong: cache reads typically cost about one tenth of input price; mixing them into one number can be off by an order of magnitude.
The second thing is handling unknown models gracefully — neither throwing nor charging zero. There is a very engineering-minded piece of code: when the user uses a model the local pricing table does not recognise, the system falls back to the default model’s price to estimate cost, and at the same time emits an “unknown model price” event so the team finds out. That event flows into Anthropic’s internal analytics, telling them “a wave of users are using some new model but the client price table hasn’t been updated yet”, which becomes the trigger for the next release. The product judgement behind this fail-soft-plus-alert is clear: throwing would crash the agent (bad UX) and returning zero would make the user think a new model is free (worse UX); falling back to the default price plus an internal alert keeps the user unbroken without losing the “we need to update the price table” signal.
The third thing is letting the user see their session cost report straight in the terminal with /insights. Implementation is unusual: it reads every session’s JSONL file out of ~/.claude/projects/<dir>/sessions/ (each project gets its own subdirectory — clean namespacing), then runs Opus twice — once to extract a structured fact sheet of “what happened in this session”, and once to take those facts and write a natural-language summary. Then it prints the report to the terminal.
Why Opus instead of cheaper Haiku? Because “analyzing your own conversation history” is very quality-sensitive — Haiku occasionally hallucinates on long contexts (output tool calls that never happened); Opus is much steadier on long-text understanding and summarization. One /insights invocation costs about $0.5 to $1, but a developer’s daily agent spend is typically $20 to $50, and the under-5% overhead is worth it — it buys the developer-experience win of “I don’t need to open a browser dashboard, I can see today’s spend right in the terminal”.
OpenClaw · One “diagnostic event bus” that funnels every observability signal through the same pipe
Section titled “OpenClaw · One “diagnostic event bus” that funnels every observability signal through the same pipe”OpenClaw’s trade-off is different again. The scenario it serves is not enterprise SRE or a single-machine IDE user, but a common ChatOps deployment shape — one agent simultaneously listening to Slack, Telegram, Discord, an in-house web UI, and an API gateway, serving many concurrent users with a fleet of workers behind it. In that scenario observability has one peculiar challenge: you cannot predict where the deployer wants the logs to land — could be Datadog, could be Sentry, could be a self-built Elasticsearch, could literally just be stderr.
To meet that challenge OpenClaw picks a classic decoupling pattern: every observation flows through one “diagnostic event” bus, and the other end of the bus is up to the deployer. To make the bus actually useful, it does three things.
The first thing is distilling everything worth observing into roughly a dozen semantically clean event types. Every event is a strongly-typed object with explicit fields, covering nearly every state worth tracking in an agent deployment — model usage (tokens, dollars, latency per call), webhook lifecycle (received, processed, error), message queue (enqueue, process), session state plus a “stuck” signal, queue-lane workflows, single agent run attempts, heartbeats, and one very distinctive event for “the tool is stuck in a loop”.
OpenClaw openclaw/src/infra/diagnostic-events.ts:1-100 — DiagnosticEventPayload 13 variants: model.usage / webhook.received|processed|error / message.queued|processed / session.state|stuck / queue.lane.enqueue|dequeue / run.attempt / diagnostic.heartbeat / tool.loop
type DiagnosticBaseEvent = {  ts: number;  seq: number;};
export type DiagnosticUsageEvent = DiagnosticBaseEvent & {  type: "model.usage";  sessionKey?: string;  sessionId?: string;  channel?: string;  provider?: string;  model?: string;  usage: {    input?: number;    output?: number;    cacheRead?: number;    cacheWrite?: number;    promptTokens?: number;    total?: number;  };  lastCallUsage?: { ... };  context?: { limit?: number; used?: number };  costUsd?: number;  durationMs?: number;};
// 12 more event types...
Every event carries two shared fields — a timestamp and a globally monotonic sequence number. These two fields look plain but solve a very specific problem: when several events fire nearly simultaneously, their millisecond-precision timestamps can collide, making downstream time-series analysis unable to tell which came first; the monotonic sequence number is a tiebreaker — “even if timestamps match, I still know which one came later”.
The second thing is dispatching events through a listener pattern. Any piece of code can register a listener function telling the bus “I care about these events, please pass them to me”. The register call immediately returns an unsubscribe handle — calling it removes the listener with no extra bookkeeping. This pattern makes adding a new backend trivial: forward events to Datadog by writing one listener that translates them to OTEL; forward errors to Sentry by writing another listener; persist to local SQLite by writing yet another — all of this is entirely decoupled from the core agent code.
The dispatch function itself does a few thoughtful engineering safeguards:
OpenClaw openclaw/src/infra/diagnostic-events.ts:171-242 — Global listener + recursion guard at depth=100; emitDiagnosticEvent injects seq + ts; onDiagnosticEvent returns an unsubscribe function
export function emitDiagnosticEvent(event: DiagnosticEventInput) {  const state = getDiagnosticEventsState();  if (state.dispatchDepth > 100) {    console.error(      `[diagnostic-events] recursion guard tripped at depth=${state.dispatchDepth}, dropping type=${event.type}`,    );    return;  }  const enriched = {    ...event,    seq: (state.seq += 1),    ts: Date.now(),  } satisfies DiagnosticEventPayload;  state.dispatchDepth += 1;  for (const listener of state.listeners) {    try {      listener(enriched);    } catch (err) {      console.error(`[diagnostic-events] listener error type=${enriched.type} seq=${enriched.seq}: ${errorMessage}`);    }  }  state.dispatchDepth -= 1;}
export function onDiagnosticEvent(listener: (evt: DiagnosticEventPayload) => void): () => void {  const state = getDiagnosticEventsState();  state.listeners.add(listener);  return () => state.listeners.delete(listener);}
There are three very clever bits in that code.
The first is the “recursion guard”. Picture this: a listener responds to an event by emitting a new event (say, “I see model.usage, let me emit a cost_alert”), and that new event triggers further listeners that emit more events — without protection the whole system recurses forever until it blows the stack. OpenClaw uses a “dispatch depth” counter: each entry into emit increments it, each exit decrements; once depth exceeds 100, the event is simply dropped with an error logged. This is the engineering posture “I would rather lose observability data than let the agent’s main flow crash”.
The second is “listener isolation”. Each listener call is wrapped in try-catch — if some listener has a bug and throws, the error gets swallowed and written to stderr, but it does not affect the other listeners. Sounds basic but matters a lot when multiple observability backends coexist — you do not want a bug in the Datadog listener to silently knock out the Sentry listener.
The third is “the sequence number is injected at emit time”. Notice seq is a global counter incremented inside the emit function, not passed by the event producer. This guarantees that all events have a globally monotonically increasing sequence number — no gaps, no duplicates, consistent order even with several concurrent turns emitting at once.
The third thing is using a special tool.loop event type to make “the agent got stuck” first-class observable. This is the most distinctive of all OpenClaw’s diagnostic events:
export type DiagnosticToolLoopEvent = DiagnosticBaseEvent & { type: "tool.loop"; sessionKey?: string; sessionId?: string; toolName: string; level: "warning" | "critical"; action: "warn" | "block"; detector: "generic_repeat" | "known_poll_no_progress" | "global_circuit_breaker" | "ping_pong"; count: number; message: string; pairedToolName?: string;};The event type itself tells a story — it openly acknowledges that agents do get stuck, and it makes “I detected that the agent is stuck” a first-class observable signal instead of burying it in some log file for ops to dig through. The “detector” field tells you which of four loop detectors triggered:
- One called “generic repeat” — the same tool was called with identical arguments N times in a row (think: agent looping on
ls). - One called “known poll no progress” — some tools (
git status,docker ps) are semantically polling tools; the agent keeps calling them but every return is the same, a textbook case of “waiting for something that will never happen”. - One called “global circuit breaker” — total tool calls in a single session exceeded a threshold regardless of which tool.
- One called “ping pong” — two agents are bouncing the question back and forth, every call has different arguments so looking at either agent alone reveals no repetition, but from outside the system it is an obvious A→B→A→B pattern.
Each detector corresponds to a typical failure mode that agents fall into. Productising those patterns as “one of the event types on the bus” lets listeners handle them concisely — for example, subscribe to tool.loop, route critical-level events to DingTalk / Slack, and quietly record warning-level events to a database without paging anyone.
Hermes · Making “how confident am I in this number” a first-class citizen of the cost system
Section titled “Hermes · Making “how confident am I in this number” a first-class citizen of the cost system”Hermes invests its observability energy in a completely different place from the other three — almost all of its engineering effort goes into one thing: tagging every cost record with metadata describing how confident the system is in that number. The context is: Hermes deploys as a privacy-sensitive local service (no remote reporting), so every spending number sits in a local database; meanwhile it supports dozens of different model providers (OpenAI, Anthropic, Google, Cohere, Mistral, OpenRouter, self-hosted models…), and each has its own billing model and data accuracy.
If Hermes only stored “cost: $0.0234” in SQLite, a very bad situation would arise — the user sees a monthly bill of $200 but the provider actually charges $250 and they have no way to tell whether that $50 gap is “some provider didn’t return cost so local estimation undershot”, “a bug in my code”, or “the provider’s API itself misbehaved”. Hermes makes that uncertainty explicit:
Hermes hermes-agent/agent/usage_pricing.py:27-77 — CanonicalUsage (5 token dimensions + request_count) plus BillingRoute (provider + model + base_url + billing_mode) plus PricingEntry (5 dimensions + source + version + fetched_at) plus CostResult (amount_usd + status + source + label + pricing_version + notes)
CostStatus = Literal["actual", "estimated", "included", "unknown"]CostSource = Literal[    "provider_cost_api",    "provider_generation_api",    "provider_models_api",    "official_docs_snapshot",    "user_override",    "custom_contract",    "none",]

@dataclass(frozen=True)class CanonicalUsage:    input_tokens: int = 0    output_tokens: int = 0    cache_read_tokens: int = 0    cache_write_tokens: int = 0    reasoning_tokens: int = 0    request_count: int = 1    raw_usage: Optional[dict[str, Any]] = None
    @property    def prompt_tokens(self) -> int:        return self.input_tokens + self.cache_read_tokens + self.cache_write_tokens
    @property    def total_tokens(self) -> int:        return self.prompt_tokens + self.output_tokens

@dataclass(frozen=True)class BillingRoute:    provider: str    model: str    base_url: str = ""    billing_mode: str = "unknown"

@dataclass(frozen=True)class PricingEntry:    input_cost_per_million: Optional[Decimal] = None    output_cost_per_million: Optional[Decimal] = None    cache_read_cost_per_million: Optional[Decimal] = None    cache_write_cost_per_million: Optional[Decimal] = None    request_cost: Optional[Decimal] = None    source: CostSource = "none"    source_url: Optional[str] = None    pricing_version: Optional[str] = None    fetched_at: Optional[datetime] = None

@dataclass(frozen=True)class CostResult:    amount_usd: Optional[Decimal]    status: CostStatus    source: CostSource    label: str    fetched_at: Optional[datetime] = None    pricing_version: Optional[str] = None    notes: tuple[str, ...] = ()
The type definitions above hide the essence of Hermes’s entire cost system — they split “price credibility” into six levels from high to low, and let the final cost result carry two axes simultaneously: “how was this number derived” and “how confident am I in it”.
The first ranking is “price source” — meaning “where does this unit price come from”. The priorities, from high to low, read like this:
- provider_cost_api (most accurate): the provider’s API directly tells you in the response “this call cost $0.0234”. This is the most trustworthy — the provider computed the real amount, so it cannot disagree with the final bill. Aggregator platforms like OpenRouter, Together, and Replicate are starting to expose this.
- provider_generation_api: the response carries exact token counts with detailed breakdown (input/output/cache_read/cache_write) but no direct dollar amount. You have to multiply by your local unit prices, but because the token counts are provider-authoritative, the resulting figure tracks the actual bill within a percent.
- provider_models_api: the provider’s “list models” API tells you “this model’s input is $0.0025”. Fresher than an offline snapshot — the moment the provider changes prices online, the next pull picks it up.
- official_docs_snapshot: a price snapshot copied into the local code, like Claude Code does. Accurate but lagging — between a provider price change and a snapshot update there is a window of inaccuracy.
- user_override: the user writes “this model uses this price” in a config — common for self-hosted models or private contract pricing.
- custom_contract: enterprise contract pricing. In theory user_override and custom_contract are both “the user knows best”, but they are ranked last on purpose — these two sources are the most frequently wrong in practice (user typoed, contract not updated, copied the wrong file), so provider real-time data is given higher priority for accuracy.
The second ranking is “cost status” — meaning “how certain is this number”. It has four values:
- actual: the actual amount returned by the provider’s API; highest confidence.
- estimated: a local computation against the pricing table — may diverge from the final bill by a few percent.
- included: this call is actually covered by the user’s subscription (for instance, when the user is on ChatGPT Plus and the agent goes through ChatGPT’s built-in auth, this call costs the user nothing extra). This status matters a lot — without it the computed “this month’s spend” would significantly overstate what the user actually paid.
- unknown: data simply unavailable, amount left blank. The frontend sees this status and shows “price unknown” so the user knows it is missing data, not free.
The third design is attaching a source URL and a pricing version to every price record. The local _OFFICIAL_DOCS_PRICING dictionary covers 30+ models across anthropic, openai, google, cohere, and so on, and every record carries two audit fields: source URL (which webpage was this price copied from) and pricing version (2026-05-01 style). Six months later when the user looks back at their cost stats and notices an odd price, they can trace it back to “oh this came from openai.com/pricing on 2026-05, OpenAI hadn’t raised prices yet”. That auditability is mandatory for enterprise users.
The fourth design is dropping cost results into a local database and exposing one command that turns them into a report. All usage data goes into local SQLite — not just the amount but also the status, source, pricing version, and notes. Hermes ships a local tool called InsightsEngine that queries this database directly, doing aggregations by model, by time, by session, and printing a readable report to the terminal. The entire data path has no remote reporting — this is Hermes’s biggest difference from the other three. Privacy is elevated to a very high priority; the cost data never leaves the user’s machine, even at the cost of giving up a unified cross-machine view.
§4 · What They Agree On
Section titled “§4 · What They Agree On”Despite wildly different engineering trade-offs, the four systems converge on five surprisingly consistent fundamentals — think of these as the “required curriculum” for any agent observability system.
The first is recording token usage along at least four independent dimensions. The minimum split is: pure input tokens, pure output tokens, cache-hit (read) tokens, cache-write tokens. If your model is something like OpenAI o1 or Anthropic extended thinking that exposes a reasoning step, add a “reasoning tokens” dimension; if the model supports server-side web search, add a “web search requests” dimension. These four to six dimensions cannot be collapsed into “total tokens” because their unit prices differ dramatically — cache reads typically cost about one tenth of input price; cache writes cost 1.25x input price. If you only track totals and multiply by some unified rate, the computed bill can be off by an order of magnitude.
The second is computing cost by multiplying each dimension’s usage by its own price and summing, never using a single “average rate”. This is the direct corollary of the first point — different unit prices mean separate computation. Codex, Claude Code, and Hermes each implement this dimension-wise computation function; OpenClaw leaves the cost field for the gateway to fill but still requires the gateway to compute it dimension-wise.
The third is making session history replayable. The persistence mechanism differs — Codex uses rollout-trace bundles with a reducer, Claude Code drops each session into a JSONL file under the project directory, Hermes stuffs everything into local SQLite, OpenClaw hands the decision to listeners — but none of them implement “replay by rerunning”. Rerunning runs into LLM nondeterminism, external state, and changed API state — near-impossible to reproduce exactly. So the four systems treat history as “look at a snapshot” rather than “re-execute”.
The fourth is not crashing on unknown models. When a user invokes a model the local pricing table has never heard of, the worst response is throwing (agent crashes, user loses the conversation), and the second worst is charging zero (user thinks the new model is free). All four pick “fall back to some default plus tell the team”: Claude Code uses default-model pricing plus an internal alert event, Hermes marks the status as unknown so the frontend shows “price unknown”, OpenClaw simply leaves the cost field blank and lets downstream decide.
The fifth is turning off remote reporting in development mode by default. Codex uses Rust’s cfg!(debug_assertions) compile-time switch to flip the exporter to None for debug builds; OpenClaw defaults diagnostics off, requiring users to opt in. The engineering discipline behind both is the same: development tests produce all sorts of weird metric spikes (infinite loops, huge inputs, intentional failures); if that data leaks into production monitoring dashboards, operators get misled into believing production is broken, and the whole team drowns in noise.
§5 · Where They Differ
Section titled “§5 · Where They Differ”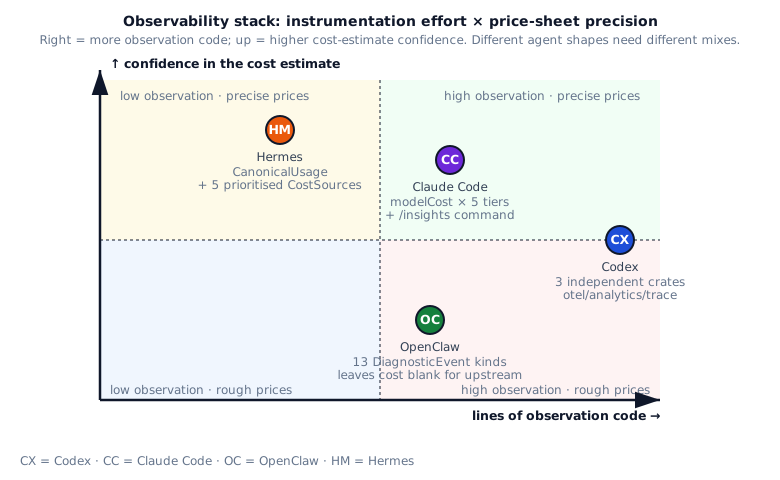
Four typical scenarios:
- Enterprise SaaS agent: borrow Codex’s OTEL + analytics + rollout-trace triad. Plug into Datadog / Honeycomb / Splunk. Replay offline.
- IDE / dev-tool agent: borrow Claude Code’s hardcoded modelCost +
/insights. Developers love terminal reports more than remote dashboards. - Multi-platform ChatOps: borrow OpenClaw’s DiagnosticEvent + listener pattern. Events flow out; the deployer picks the landing zone.
- Privacy-sensitive workloads: borrow Hermes’s CostSource priority ladder + all-local SQLite. No remote reporting.
§6 · My Take
Section titled “§6 · My Take”| System | Score | Strengths | Risks |
|---|---|---|---|
| Codex | ★★★★★ | Three standalone crates with clean separation (otel / analytics / rollout-trace). Four exporter variants (OTLP HTTP/gRPC + Statsig + None) cover enterprise, internal, and dev. rollout-trace turns offline replay into a standard capability. AcceptedLineFingerprints measures code retention rate. | Big surface area; newcomers struggle to spot the three crate boundaries. Statsig default endpoint is hardcoded, hinting at vendor lock-in. |
| Claude Code | ★★★★ | Five hardcoded cost tiers keep things simple. tokensToUSDCost folds all 5 dimensions. tengu_unknown_model_cost is the safety net. /insights uses Opus to analyze itself. sessionStorage in ~/.claude/projects/ is a clean partition. | Hardcoded prices mean every new model requires a release. No remote OTEL exporter. Running Opus twice in /insights is expensive. |
| OpenClaw | ★★★★ | 13 DiagnosticEvent types form a clean taxonomy (usage / webhook ×3 / message ×2 / session ×2 / queue ×2 / run / heartbeat / tool.loop). Listener pattern accommodates any backend. The four tool.loop detectors operationalize agent runaway. | No built-in cost computation (costUsd is left for the caller). No remote exporter shipped. Event schema relies on TS types; no JSON schema for external consumers. |
| Hermes | ★★★★★ | Five CostSource priorities is the most complete cost model in the industry. PricingEntry carries source_url + pricing_version for auditability. Four CostStatus values clearly distinguish actual / estimated / included / unknown. InsightsEngine queries SQLite directly. | All-local means no unified view across multi-host deployments. Pricing updates ride code releases. Lack of OTEL exporter is unfriendly to SRE teams. |
§7 · Build recipe
Section titled “§7 · Build recipe”Below is the recipe distilled from the four systems for writing your own observability + cost accounting. Get the basic multi-dimensional token tracking + accurate cost calculation working first, then add production-grade features (decoupled architecture, multi-source pricing, user-facing reports), finally avoid six common mistakes that pollute metrics or slow down the hot path.
Build recipe
最小可行
- At least 4 token dimensions (borrow from everyone): input (input tokens) + output (output tokens) + cache_read (cache reads, ~1/10 of input price) + cache_write (cache writes, ~1.25x of input price); add reasoning_tokens / web_search as optional 5th dimensions; tracking only input+output makes cache optimization gains invisible
- Cost formula sums each dimension separately (borrow from Claude Code's tokensToUSDCost): each dimension queried for its own price, multiplied independently, then summed; can't use "average price" simplification — the four prices differ by up to an order of magnitude (cache_read is 12.5x cheaper than cache_write)
- Unknown models fall back to default + emit alert event (borrow from Claude Code's tengu_unknown_model_cost): when model ID has no price entry, fall back to default estimate and emit telemetry alert (so you know an unknown model appeared); never crash (breaks main flow) and never silently return 0 (misleads users into thinking it's free)
- Debug builds disable remote reporting (borrow from Codex' cfg!(debug_assertions)): development runs (tests / debugging) trigger massive call volume; if these hit production metrics they pollute data; use compile-time switch to disable OTEL in debug builds, enable in release
进阶
- Observability code in its own crates (borrow from Codex): codex-otel / codex-analytics / codex-rollout-trace each as separate crates, hot path only touches small writer API (doesn't directly depend on heavy SDKs like OTLP / Statsig); this lets observability upgrade / swap / remove independently (e.g. switching to Datadog doesn't require touching business code)
- Three exporter tiers: OTLP HTTP + OTLP gRPC + in-house default (borrow from Codex). Enterprise users connect to their OTLP (HTTP or gRPC depending on their infra preference), default users (not configured) hit in-house exporter (sends to your service), dev environments use None (no reporting); three tiers cover all scenarios
- Trace bundle + reducer pattern (borrow from Codex): raw events stream into JSONL synchronously (non-blocking), reducer offline computes reduced state (aggregations / dashboards); makes "viewing trace" not block hot path; this is standard event sourcing pattern
- AcceptedLineFingerprints (borrow from Codex): measures how much model-generated code survives (the most critical product metric for coding agents); line-level fingerprint stores only hash not content (privacy), can track lifecycle of same line from generation through modification / deletion
- /insights command (borrow from Claude Code + Hermes): let users see their own usage report (model breakdown / cost / token distribution) in their terminal, dashboard not required; this lowers the barrier to "look at metrics", users can check anytime
- DiagnosticEvent ×13 + global listener (borrow from OpenClaw): event schema strongly enforced in type system (which fields required / optional), global listener decides where to land (stdout / stderr / file / OTEL); when adding new event type, only one place changes, listeners auto-receive
- tool.loop detectors ×4 (borrow from OpenClaw): generic_repeat (same tool repeated) / known_poll_no_progress (known polling pattern with no progress) / global_circuit_breaker (global circuit) / ping_pong (multiple tools called back and forth); makes "agent runaway" first-class signal so SREs can see the trend
- CostSource priority ×5 (borrow from Hermes): provider_cost_api (most accurate) > generation_api (returned at generation time) > models_api (model metadata) > docs_snapshot (scraped from docs) > user_override (user-entered) > custom_contract (enterprise contract price); multi-source pricing sorted by accuracy, traceable
- CostStatus ×4 (borrow from Hermes): actual (paid, from provider API) / estimated / included (covered by package, no extra cost) / unknown; let downstream consumers know how accurate the number is, avoid reporting estimated as actual to finance
- PricingEntry carries source_url + pricing_version (borrow from Hermes): each price entry tagged with the URL it was scraped from (snapshot date) + pricing_version (price version number), auditing answers "where and when did this price come from", traceable when models reprice
- Privacy mode (borrow from Hermes): all-local SQLite + terminal report, no remote reporting; this is required for enterprise / compliance scenarios, otherwise they won't adopt at all
一开始别做
- Don't collapse all tokens to one rate — input cost ≠ cache_read cost ≠ web_search cost, conflating them throws costs off by an order of magnitude; most common error is multiplying all tokens by input price, which makes cache optimization gains completely invisible
- Don't emit telemetry synchronously in the hot path — OTLP sending is network IO (can be slow / fail), synchronous emission blocks agent loop; use sender pattern (write to in-memory channel) / async (background task) / batch (batch sending), swallow send failures (monitoring can't break business)
- Don't let listener exceptions crash the main flow — listeners are user / plugin code that may have bugs; wrap each listener in try-catch, write exception to stderr without re-throwing (monitoring can't affect business)
- Don't assume the upstream API always returns cost — provider API may not return it (older versions / error cases), need fallback to local estimation (token count × your stored unit price) + mark CostStatus.estimated; can't crash, can't return 0
- Don't hardcode prices without versioning — when models reprice (e.g. Claude 3.5 → 3.7 doubling), no way to know what date the old data's price was based on; prices must have version + timestamp + source
- Don't slap OTEL spans on every hot path — span has overhead (creation / context propagation / serialization), profile to see what's slow then add targeted spans, otherwise trace noise drowns out actual problems
§8 · Four observability stacks side by side
Section titled “§8 · Four observability stacks side by side”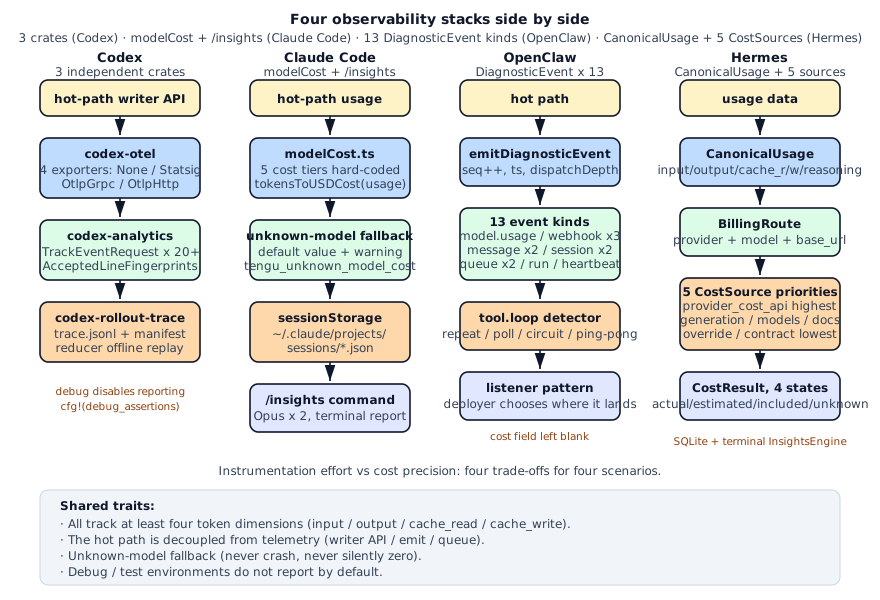
Side by side, the observability gap is obvious. Codex aims for enterprise SRE. Claude Code aims for developer self-service. OpenClaw streams events and lets ops pick. Hermes prioritizes pricing precision while keeping everything local.
§9 · Further Reading / Source Pointers
Section titled “§9 · Further Reading / Source Pointers”§10 · Exercises
Section titled “§10 · Exercises”- 🟢 Hand-compute a turn: Given
{input: 8000, output: 2000, cache_read: 12000, cache_write: 4000}withclaude-sonnet-4(COST_TIER_3_15), compute the USD cost. Expected:(8/1000)*3 + (2/1000)*15 + (12/1000)*0.3 + (4/1000)*3.75 = 0.024 + 0.030 + 0.0036 + 0.015 ≈ $0.0726. - 🟠 Implement a DiagnosticEvent listener: write a Python function
on_event(event: dict)that accumulatescostUsdfrom events whereevent['type'] == 'model.usage'and prints the running total every 100 events. - 🟠 CostSource priority: write
pick_pricing(entries: list[PricingEntry]) -> PricingEntrythat returns the highest-priority entry givenprovider_cost_api > provider_generation_api > provider_models_api > official_docs_snapshot > user_override > custom_contract > none. - 🔴 Trace bundle replay: Use a JSONL file as a fake
trace.jsonl, one event per line{type, ts, payload}. Write a reducer that aggregatestype == "turn.start"/"turn.end"pairs to compute turn count, total elapsed time, and average tokens per turn.
§11 · Interview drill: 10 questions with worked answers
Section titled “§11 · Interview drill: 10 questions with worked answers”Q1 · Concept: What’s the minimum number of token dimensions to track? Why can’t you just count total tokens?
Minimum 4: input / output / cache_read / cache_write. Counting total alone is off by an order of magnitude.
Price differences (Anthropic claude-sonnet-4 example):
- input: $3 / 1M token
- output: $15 / 1M token
- cache_read: $0.3 / 1M token (10% of input)
- cache_write: $3.75 / 1M token (1.25x of input)
A typical turn has 30k input tokens, of which 25k hit cache (cache_read), 5k don’t (input). Counting “30k total input” at input price:
30 * 3 / 1000 = $0.09
Actual cost:
5 * 3 / 1000 + 25 * 0.3 / 1000 = 0.015 + 0.0075 = $0.0225
4x off. Over a month, that’s an order of magnitude difference.
The 5th dimension:
reasoning_tokens: OpenAI o1 / Anthropic extended thinking billed separatelyweb_search_count: each web search $0.01-0.05 (per provider)request_count: fixed per-request fee (some providers)
Hermes CanonicalUsage 6 fields cover all 6 dimensions:
@dataclassclass CanonicalUsage: input: int output: int cache_read: int cache_write: int reasoning: int request_count: intFollow-up: “How to handle unknown models?” Claude Code uses tengu_unknown_model_cost event + default value; don’t return 0 (lies “free”) or raise (crashes agent).
Source: hermes-agent/agent/usage_pricing.py:CanonicalUsage + claude-code/src/utils/modelCost.ts.
Q2 · Concept: Benefits of Codex splitting observability into 3 standalone crates?
codex-otel / codex-analytics / codex-rollout-trace have different responsibilities:
codex-otel — real-time metrics / trace:
- Real-time export to OTLP / Statsig backend
- For SRE on-call alerting
- Hottest path call frequency
codex-analytics — business events:
- Offline analysis of “how users use agent”
- TrackEventRequest 20+ types including SkillInvocation / HookRun / TurnEvent / AcceptedLineFingerprints
- For product / growth teams
codex-rollout-trace — full session replay:
- trace.jsonl + manifest.json on disk
- Reducer computes reduced state offline, replay doesn’t block hot path
- For debug / postmortem
Why not merge?
Each crate has different users / deployment:
- otel for SRE, hot data
- analytics for PM / growth, warm data
- rollout-trace for devs, cold data
If merged, “I only want OTLP but forced to bundle analytics deps” happens. codex-otel compile output ~800KB, codex-rollout-trace adds 2MB. Each scenario different, standalone crates give flexibility.
Follow-up: “Cross-crate sharing?” Shared schema (TraceMessageId, etc.) extracted to codex-protocol crate. All three observability crates share protocol, independent of each other.
Source: codex/codex-rs/otel/ + codex/codex-rs/analytics/ + codex/codex-rs/rollout-trace/.
Q3 · Architecture: Why is Hermes’s 5-CostSource priority ordered this way?
provider_cost_api > provider_generation_api > provider_models_api > official_docs_snapshot > user_override > custom_contract > none
Core principle: closer to provider’s system, more real-time, higher confidence.
Tier-by-tier:
provider_cost_api: API returns{"cost_usd": 0.0234}directly. Computed by provider, accuracy = 100%. OpenRouter / Together / Replicate moving this way.provider_generation_api: generation endpoint returns{"prompt_tokens": ..., "completion_tokens": ..., "cost": ...}. Also provider-computed, but need to multiply price again.provider_models_api: models list API returns{"id": "gpt-4o", "pricing": {"input": 0.0025, "output": 0.010}}. Fresher than docs snapshot, but need self-multiplication.official_docs_snapshot: hardcoded from official pricing docs. Snapshot time clear but doesn’t follow real-time changes.user_override: user manually setspricing.jsonto override. Could deviate from reality.custom_contract: enterprise custom contract (actual spend differs from list price). User knows best, so placed last.
Why isn’t user_override first?
Tension: “user knows best” holds for individual devs but not enterprises. Enterprise users may misconfigure (forgot to update / copied wrong file), provider real-time data is most accurate. So default sorts by provider proximity, user override is last fallback.
What’s none?
Unknown model, no pricing found. CostStatus = unknown, frontend shows “price unknown” so user knows. Much better than returning 0.
PricingEntry carries source_url + pricing_version: auditing reveals “this 0.0025 was scraped from openai.com/pricing on 2024-10-01.” Half a year later when OpenAI changes prices, can trace why old data uses old price.
Follow-up: “What if provider’s cost_api is also wrong?” Record source_url so user can trace back to provider request. Hermes CostResult.notes field is for this kind of “I returned X but downstream thinks it’s wrong” trace.
Source: hermes-agent/agent/usage_pricing.py:CostSource + estimate_usage_cost.
Q4 · Concept: Why doesn’t OpenClaw just use OpenTelemetry instead of 13 custom DiagnosticEvent types?
OpenClaw picks 13 custom events + listener pattern over direct OTel. The trade-offs:
1. Event schema aligned with business semantics
webhook.received / webhook.processed / webhook.error are agent business concepts. OTel spans are generic trace concepts. Using OTel directly:
- Need to write attributes to express “this is webhook receive”
- Downstream analysis needs to parse attributes for business semantics
- Investigation is harder when issues arise
13 DiagnosticEvent types encode business semantics directly into type field, listener immediately knows meaning.
2. Listener pattern goes anywhere
onDiagnosticEvent((event) => { if (event.type === 'model.usage') { forwardToOtel(event); }})Deployer writes 30 lines of code to forward to OTel. But some deployers want to forward to PostgreSQL directly, or to Slack alerts. OpenClaw doesn’t assume OTel is the only destination.
3. Recursion guard / dispatchDepth
OTel SDK has internal self-protection, but OpenClaw’s 13 events are more complex (tool.loop — “detecting agent itself stuck” event — may trigger more emits when emitted). OpenClaw’s own dispatchDepth < 100 protection is cleaner than wrapping OTel.
4. Type safety
All 13 events have TS types, compile-time field completeness guaranteed. OTel attribute is Record<string, any>, weak type inference.
Costs:
- Listener boilerplate (OTel forwarder / log forwarder / DB forwarder all written)
- No OTel ecosystem tooling (Jaeger UI / Grafana doesn’t directly consume)
- No built-in cross-service trace support (must propagate trace_id manually)
Is OpenClaw’s choice right?
For enterprise SaaS scenarios, yes. Customers have OTel / Sentry / Datadog infrastructure. OpenClaw just emits events, customers write listeners to fit their systems.
Follow-up: “Could 13 events be OTel-compatible?” Yes. Map event fields to OTel span / metric / log, listener does one transform. tool.loop and OpenClaw-specific ones become OTel custom events.
Q5 · Concept: Why is Claude Code’s /insights running Opus twice worth the cost?
/insights shows terminal report for local sessions. Implementation:
- Read
~/.claude/projects/<dir>/sessions/*.json - First Opus call: facet extraction (extract structured data: turn count / total tokens / tool call count / failure rate from session text)
- Second Opus call: summary (generate natural language report based on facets)
- Terminal print
Why is this expensive design worth it?
1. Users don’t need a dashboard
Devs using agent care about “how much did I chat with agent today” / “which prompt was most expensive” / “trend in the last hour.” One local /insights command outputs report — more convenient than opening browser to see Grafana / Datadog.
2. Opus excels at processing unstructured data
session.json has message text / tool call / cost. Direct SQL group by can’t extract “what task primarily did” semantic info. Let Opus read session and give semantic summary.
3. $0.5-1 per report is reasonable
Dev may use $20-50 of agent per day, running insights $0.5-1 is < 5% overhead. Convenience of local reports > this cost.
4. Privacy
Reports generated all-local. Session data doesn’t go to remote dashboard. Enterprise-dev friendly (sensitive prompts don’t leave machine).
Why two calls split:
- Facet extraction lets Opus do “structured” (easy, cheap)
- Summary lets Opus do “natural language” (based on previous step’s structured result, higher quality)
Merging to one call also works, but split makes both steps more controllable.
Follow-up: “Can Haiku replace Opus?” Yes, but semantic quality degrades noticeably. Haiku sometimes fabricates (“summarize what this session did” outputs tool calls that don’t exist). Opus is much more stable for long-text understanding. “Expensive but worth it” design.
Source: claude-code/src/commands/insights.ts + claude-code/src/utils/queryWithModel.ts.
Q6 · Real-world: Adding observability to your agent, zero to production?
Four phases: structured tokens → price + cost → DiagnosticEvent → /insights command.
Day 1-2 · Structured tokens
@dataclassclass Usage:    input: int    output: int    cache_read: int = 0    cache_write: int = 0    reasoning: int = 0
    def total_tokens(self) -> int:        return sum([self.input, self.output, self.cache_read, self.cache_write, self.reasoning])
Every LLM call return fills Usage. Never just store total_tokens.
Day 3-4 · Price + cost
PRICING = {    "claude-sonnet-4": {        "input": 3 / 1e6,        "output": 15 / 1e6,        "cache_read": 0.3 / 1e6,        "cache_write": 3.75 / 1e6,    },}
def cost(usage: Usage, model: str) -> float:    p = PRICING.get(model)    if not p:        log.warning(f"Unknown model {model}, using fallback")        p = FALLBACK_PRICING    return sum(getattr(usage, k) * v for k, v in p.items())
Borrow Claude Code tokensToUSDCost.
Day 5-7 · DiagnosticEvent emit
def emit_event(event_type: str, **kwargs):    event = {        "type": event_type,        "ts": time.time(),        "seq": next_seq(),        **kwargs,    }    for listener in listeners:        try:            listener(event)        except Exception as e:            log.error(f"Listener failed: {e}")
emit_event("model.usage", model=model, usage=usage, cost_usd=cost(usage, model))
Borrow OpenClaw listener pattern.
Week 2 · /insights command
@cli.command()def insights(): """Show terminal cost report.""" sessions = load_sessions(SESSIONS_DIR) total_cost = sum(s.cost_usd for s in sessions) by_model = group_by_model(sessions) print(f"Total: ${total_cost:.2f}") for model, cost in by_model.items(): print(f" {model}: ${cost:.2f}")Borrow Hermes InsightsEngine + Claude Code /insights.
Week 3-4 · Add OTLP exporter (optional)
from opentelemetry.exporter.otlp.proto.http.trace_exporter import OTLPSpanExporterfrom opentelemetry.sdk.trace import TracerProviderfrom opentelemetry.sdk.trace.export import BatchSpanProcessor
provider = TracerProvider()provider.add_span_processor(BatchSpanProcessor(OTLPSpanExporter()))trace.set_tracer_provider(provider)
Borrow Codex codex-otel exporter approach.
Key takeaways:
- Don’t start from OTel: OTel is complex, many deps. First emit_event home-style, export to OTel later when needed
- Pricing table version:
PRICING_VERSION = "2026-05-15"for audit - /insights early: dev self-service report is high-value low-cost
- OTLP not day-one: add when SRE team needs
Follow-up: “How to update pricing table?” Review monthly, sync when new models launch. Or use Hermes approach with provider models API auto-fetch. Full automation saves trouble but increases ops.
Source mosaic: Borrow Hermes usage_pricing.py + Claude Code modelCost.ts + OpenClaw diagnostic-events.ts + Codex analytics/events.rs.
Q7 · Concept: How does AcceptedLineFingerprints measure “code retention rate”?
Codex wants to know: how much model-generated code is accepted by humans?
Naive approach: model records “line count” when generating code, also when user accepts. Problem: user may accept then modify 50%. “Accept” ≠ “retention.”
Codex approach - line fingerprint:
- When model generates code, compute fingerprint (not content, hash) per line
- When user accepts, record per-line fingerprints to session DB
- When user edits / refactors / deletes file later, scan file per-line fingerprint, compare with historical fingerprints
- “Number of fingerprints still in file after 7 days / number of fingerprints originally accepted” = retention rate
Why fingerprints not content?
- Privacy: don’t upload user’s actual code
- Small data: hash 32 bytes vs line possibly 200 bytes
- Whitelist: line-level signal doesn’t pollute full-file hash
Fingerprint computation (simplified):
fn fingerprint(line: &str) -> u64 {    let normalized = normalize_whitespace(line);    let hash = xxhash64(normalized);    hash}
fn normalize_whitespace(line: &str) -> String {    line.trim().split_whitespace().collect::<Vec<_>>().join(" ")}
Normalize ensures “add space” / “change indent” doesn’t affect fingerprint. Renaming variables / changing strings DOES change fingerprint, counted as “edited.”
Industry value:
- Codex team product decisions: which generated code types have high / low retention
- User cost visibility: “you generated 5000 lines this month, retained 1500”
- Model fine-tuning data: high-retention input/output pairs make good training samples
Anti-pattern: direct code-to-cloud:
- Privacy violation
- Traffic too large
- Legal risk
Fingerprints make this doable.
Follow-up: “Without content, how to know which line?” Each fingerprint records {file_path, line_number, fingerprint}. If user modifies file, line_number may drift, need fuzzy match (look for fingerprint elsewhere in file).
Q8 · Concept: What do tool.loop’s 4 detectors identify respectively?
OpenClaw’s tool.loop is “agent itself is stuck” event type. 4 detectors for 4 typical stuck modes:
1. generic_repeat — same tool call argv repeated > N times in window
turn 1: bash("ls")turn 2: bash("ls")turn 3: bash("ls")→ generic_repeat detectedAgent dead-loops same command, no argv change. Dumbest loop.
2. known_poll_no_progress — known polling tool (git status / docker ps) with no progress
turn 1: bash("git status") → "nothing to commit"turn 2: bash("git status") → "nothing to commit"turn 3: bash("git status") → "nothing to commit"→ known_poll_no_progress detectedAgent is polling but git state hasn’t changed. Manual lookup table marks is_polling_tool: bash("git status") == true.
3. global_circuit_breaker — global circuit breaker (single-session tool call total exceeds threshold)
session 1: 50 tool callssession 2: 80 tool callssession 3: 200 tool calls→ global_circuit_breaker triggered (limit=100)Agent out of control making too many tool calls. Global threshold backstop, force stop.
4. ping_pong — agent and another agent / tool bouncing back and forth
turn 1: agent_a calls agent_b ask("X")turn 2: agent_b calls agent_a ask("Y about X")turn 3: agent_a calls agent_b ask("Z about Y")→ ping_pong detectedMost subtle loop: each tool call content differs but pattern is “two agents bouncing.” Need to look at context not single call.
Why not just rely on max_turns?
max_turns = 50 is coarse protection. Problems:
- Agent runs 49 turns all ping_pong, kill on final turn → 49 wasted
- Different task complexity, max_turns fixed is hard to set
- Agent may reasonably use 50 turns (giant refactor)
4 detectors are fine-grained, identify problems early. generic_repeat warns after 3 occurrences, no need to wait until turn 50.
Implementation:
- Maintain ring buffer of last N turns’ tool call argv
- Each
tool.useemit, run 4 detectors - Any hit → emit
tool.loopevent, listener decides if to interrupt agent
Follow-up: “What else could detectors add?” Combining LLM judge (Haiku checking “are these two turns repeating”) would be more accurate but expensive. Could also add cost_explosion (single turn cost 10x sudden increase) etc.
Source: openclaw/src/infra/diagnostic-events.ts:tool.loop + openclaw/src/agents/loop-detectors.ts.
Q9 · Engineering: How to emit telemetry in hot path without blocking?
Four typical implementations:
1. async sender + queue
import queue
event_queue = queue.Queue(maxsize=10000)
def emit_event(event):    try:        event_queue.put_nowait(event)    except queue.Full:        log.warning("Event queue full, dropping")
def background_sender():    while True:        event = event_queue.get()        send_to_backend(event)
threading.Thread(target=background_sender, daemon=True).start()
Hot path only enqueues (< 1μs), background thread sends.
2. batch + flush
batch = []last_flush = time.time()
def emit_event(event):    batch.append(event)    if len(batch) > 100 or time.time() - last_flush > 5:        flush(batch)        batch.clear()        last_flush = time.time()
Reduces backend request count. 100 events batched to 1 request.
3. fire-and-forget HTTP
async def emit_event(event):    asyncio.create_task(_send(event))
async def _send(event):    try:        async with session.post(url, json=event) as resp:            pass  # don't wait for response    except Exception:        pass  # swallow
asyncio drops send to event loop, doesn’t wait for result.
4. OTEL SDK’s built-in BatchSpanProcessor
provider.add_span_processor(BatchSpanProcessor( OTLPSpanExporter(), max_queue_size=10000, schedule_delay_millis=5000,))OTel SDK already does batch + async. Use directly.
Common across approaches:
- Swallow failures: telemetry errors shouldn’t crash agent
- Backpressure strategy: queue full → drop events, don’t block hot path
- Debug-friendly: dev env runs logs instead of real send, avoid polluting metrics
Codex’s approach:
cfg!(debug_assertions) compile switch makes debug builds use NoOp exporter, release builds use real exporter. One line for env switching.
Follow-up: “fire-and-forget drops events, what about that?” Accept it. Telemetry is “best effort,” not transactional. If an event type must not be lost (billing), separate path with reliable queue (Kafka / SQS).
Anti-pattern: sync send in hot path
def emit_event(event): requests.post(url, json=event) # blocks 200ms200ms sync send adds 200ms agent latency. Direct UX harm.
Source: Codex codex-otel/src/exporter.rs BatchSpanProcessor + Hermes agent/usage_tracker.py async update.
Q10 · Open-ended: Synthesize the strengths into a universal observability framework.
5-layer architecture:
Layer 1 · Structured tokens (mandatory)
@dataclassclass CanonicalUsage: input: int output: int cache_read: int cache_write: int reasoning: int = 0 request_count: int = 1Borrow Hermes CanonicalUsage.
Layer 2 · Multi-source pricing (mandatory)
class CostSource(Enum):    PROVIDER_COST_API = 1    PROVIDER_GENERATION_API = 2    PROVIDER_MODELS_API = 3    OFFICIAL_DOCS_SNAPSHOT = 4    USER_OVERRIDE = 5    CUSTOM_CONTRACT = 6    NONE = 99
def estimate_cost(usage, model, route) -> CostResult:    for source in CostSource:        entry = lookup_pricing(model, route, source)        if entry:            return CostResult(                amount_usd=compute(usage, entry),                status=CostStatus.ACTUAL if source <= 2 else CostStatus.ESTIMATED,                source=source,                pricing_version=entry.version,            )    return CostResult(amount_usd=None, status=CostStatus.UNKNOWN)
Borrow Hermes 5-source priority.
Layer 3 · DiagnosticEvent emit (mandatory)
def emit_event(event_type, **fields): event = {"type": event_type, "ts": time.time(), "seq": next_seq(), **fields} for listener in listeners: try: listener(event) except Exception as e: log.error(f"Listener failed: {e}")Borrow OpenClaw 13 types + listener.
Layer 4 · OTLP / Statsig exporter (optional · enterprise)
class Exporter(Enum): NoOp = "noop" Statsig = "statsig" OtlpGrpc = "otlp-grpc" OtlpHttp = "otlp-http"Borrow Codex 4 exporters.
Layer 5 · /insights terminal report (recommended)
def insights_cli(): sessions = load_sessions(SESSIONS_DIR) facets = extract_facets(sessions) summary = llm_summarize(facets, model="claude-sonnet-4") print(format_terminal_report(facets, summary))Borrow Claude Code /insights + Hermes InsightsEngine.
Contributions:
- Codex: 3 crate split + AcceptedLineFingerprints + rollout-trace replay + cfg debug switch
- Claude Code: modelCost 5 tier + tengu_unknown_model_cost + /insights with Opus
- OpenClaw: 13 DiagnosticEvent + listener pattern + tool.loop detectors
- Hermes: CanonicalUsage 6 fields + 5 CostSource priority + CostStatus 4 states + all-local SQLite
Engineering effort:
- Layer 1-2: 1 week (mandatory)
- Layer 3: 1 week (mandatory)
- Layer 4: 2 weeks (optional)
- Layer 5: 1 week (recommended)
5 weeks to v0.1.
Key decisions:
- 4 token dimensions to start, not one total
- Pricing with version + source_url
- Emit and send decoupled: hot path only enqueues
- Debug default NoOp: tests don’t pollute metrics
- /insights early: local reports are high-value low-cost
Follow-up: “Cross-language sharing?” CanonicalUsage / DiagnosticEvent schema in JSON Schema, codegen types. Specific emit / export per-language implementation. OTel itself follows this pattern (spec + per-language SDK).
Source mosaic: codex/codex-rs/otel/ + codex/codex-rs/analytics/ + claude-code/src/utils/modelCost.ts + openclaw/src/infra/diagnostic-events.ts + hermes-agent/agent/usage_pricing.py.